
Fig 4.
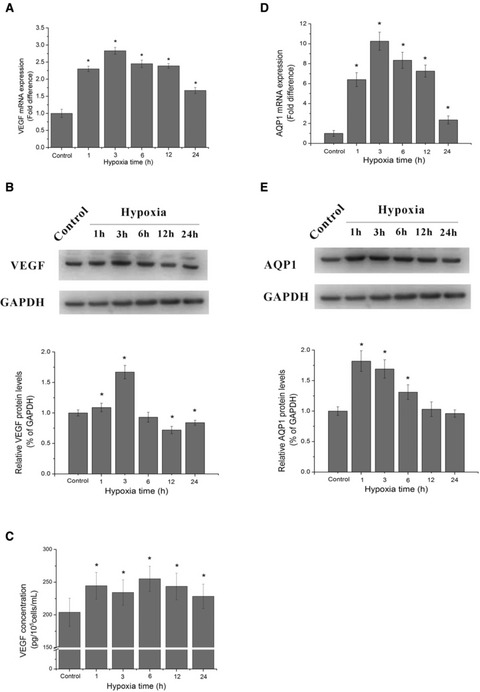
HUVECs proliferation, VEGF, AQP1 mRNA level, protein expression and VEGF accumulation in supernatant under hypoxic exposure. (A) The mRNA levels of VEGF at different hypoxic time points. (B) The protein expression of VEGF at different hypoxic time points by Western blotting analysis, the blots and the bar chart below are in one label. (C) Quantification of VEGF by ELISA assay in supernatant of HUVECs after various periods of hypoxic treatment. (D) The mRNA levels of AQP1 at different hypoxic time points. (E) The protein expression of AQP1 at different hypoxic time points by Western blotting analysis, the blots and the bar chart below are in one label. *P < 0.05 versus control group.