Fig 5.

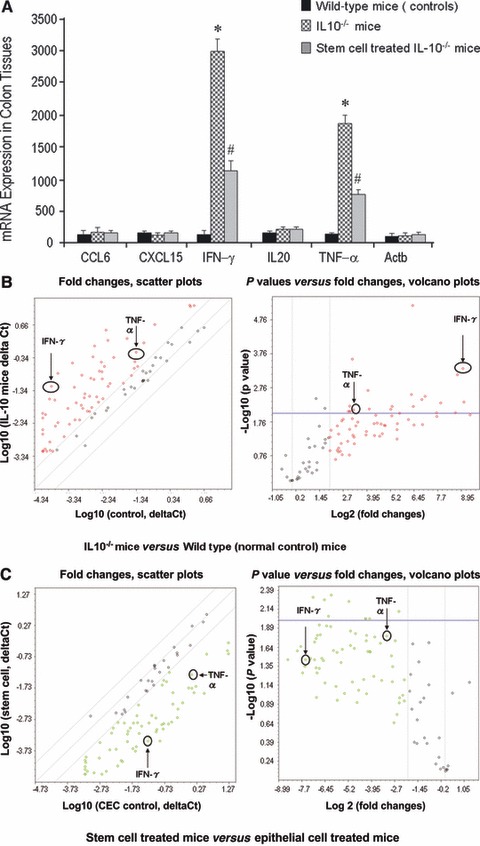
Local transplantation of CSCs inhibits inflammatory responses through TNF-α and IFN-γ dependent mechanisms. (A) Following Super-Array assay (from Table 1), CCL6, CXCL15, IFN-γ, IL20 and INF-α were tested by using quantitative real-time PCR. The data further confirmed the enhanced expression of IFN-γ and TNF-α in IL-10−/− mice (P < 0.05), whereas stem cell treated IL-10−/− mice showed significantly reduced expression of these two cytokines (P < 0.05). (B) Alterations in inflammatory cytokines, chemokines and receptor expression in IL-10−/− mice colon compared with normal control (wild-type) mice colon. Total RNA from each sample was characterized in triplicate, and the relative expression level and P values for each gene in the related samples are plotted against each other in the Scatter and Volcano Plots, depicting the relative expression levels (log 10) for selected genes in IL-10−/− mice versus normal control mice (left panel of B). In the right panel of (B), P values are plotted against fold changes. The genes for which the difference in expression levels were greater than a factor of three (fold) and/or P < 0.01 are shown to lie outside of the cut-off lines on the graph. TNF-α and IFN-γ are among the most up-regulated genes in the IL-10−/− mice group when compared to normal control (wild-type) mice. (C) Comparison of IL-10−/− mice with local stem cell treatment versus IL-10−/− mice with local epithelial cell treatment using PCR Array kits for inflammatory cytokines, chemokines and receptor. The relative expression level and P values for each gene in the related samples are plotted against each other in the Scatter and Volcano Plots, depicting the relative expression levels (log 10) for selected genes in stem cell treated mice versus epithelial cell treated IL-10−/− mice (left panel of C), In the right panel of (C), these two genes also show down-regulation after stem cells treatment compared to the epithelial cells treated group, P < 0.05.
