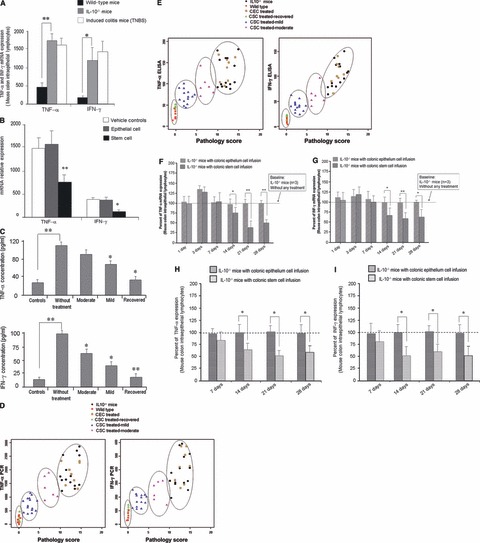
Fig 6.

Therapeutic mechanisms of transplanted stem cells. Real-time PCR was used to detect TNF-α and IFN-γ expression in mouse colonic tissues. (A) IL-10−/− mice have significantly higher levels of TNF-α and IFN-γ expression compared to normal control (wild-type) mice (P < 0.01). On the other hand, IL-10−/− mice had significantly decreased local TNF-α and IFN-γ release 2 weeks after stem cell transplantation (compared to epithelial cell treated IL-10−/− mice and vehicle control IL-10−/− mice (B:P < 0.001 and P < 0.05, respectively). To confirm the changes in TNF-α and IFN-γ release from mouse colon, ELISA assays were used (C). They showed that levels of release of TNF-α and IFN-γ were closely associated with the degree of resolution of colitis that was induced by local CSC therapy (Control = wild-type mice; without treated = IL-10−/− mice without treatment; moderate = IL-10−/− mice after CSC treatment, which showed moderate inflammation histologically; mild = IL-10−/− mice after CSC treatment, which showed mild inflammation; Recovered = IL-10−/− mice after CSC treatment, which showed no inflammation. There was a significant difference in TNF-α concentrations between the control and without treatment group (*P < 0.01). Moreover, there was also a significant difference in TNF-α concentrations between the without treated and the mild and recovered groups (*P < 0.05). A substantial difference in IFN-γ concentrations was also observed between the control and without treatment group (P < 0.01). There was also a notable alteration in IFN-γ concentrations and between the moderate, mild and recovered groups when compared to the without treated group (P < 0.05, 0.05 and 0.01). (D and E) Pearson correlation analysis (using SAS) showed that the pathology score positively correlated with TNF-α (r= 0.81; P < 0.001) and IFN-γ (r= 0.74; P < 0.001) expression in both real-time PCR (D) and ELISA assays, TNF-α (r= 0.77; P < 0.001) and IFN-γ (r= 0.82; P < 0.001) (E). (F and G) both represent TNF-α/INF-γ expression within the intraepithelial lymphocytes (each time point representing three mice). There was decreased expression which started at day 14 day of TNF-α and INF-γ that continued to 4 weeks following local CSCs transfusion compared to CECs treated mice. Flow cytometry analysis further demonstrated decreased TNF-α and INF-γ expression within colonic lymphocytes from day 14 up to day 28 following CSCs treatment compared to CECs treated mice (H and I).
