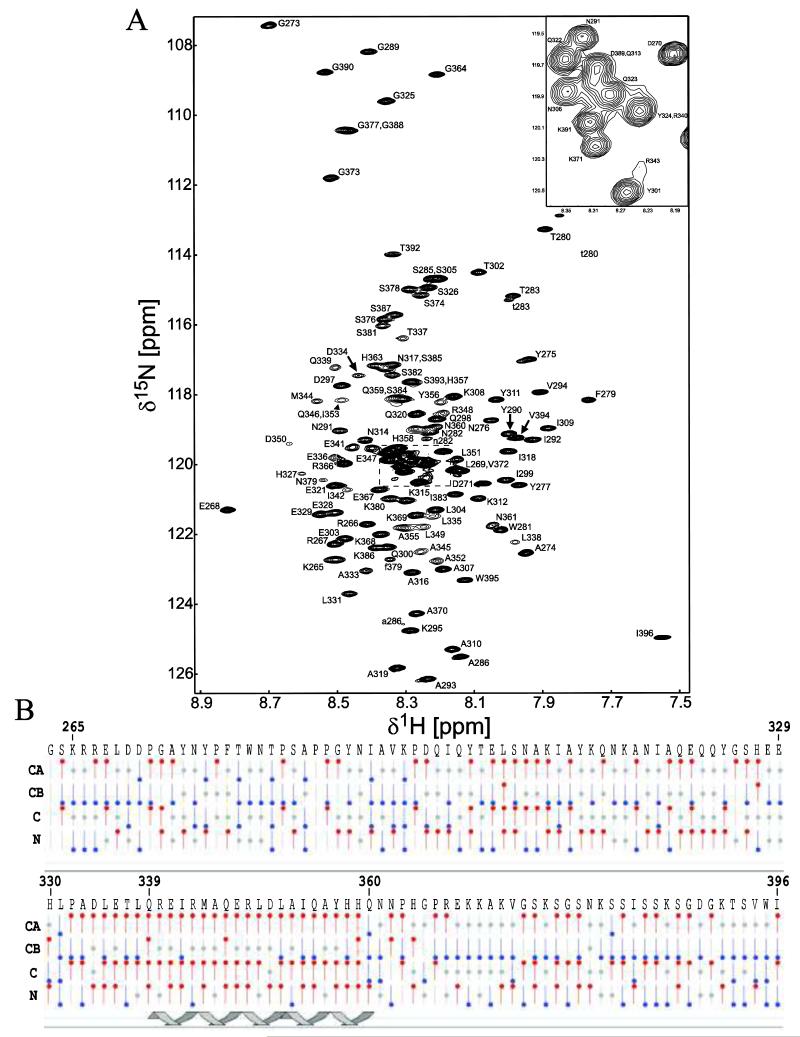
Figure 2. 15N-HSQC spectrum and chemical shift index of the Cx45CT monomer in phosphate-buffered saline with 30% deuterated-acetonitrile (pH 5.8) at 37°C.
A) Peak assignments for the backbone amides are indicated with numbering corresponding to the full-length Cx45 protein. The seven residues (F279, T280, W281, N282, T283, S285, A286) affected by proline cis-trans isomerization have a second weaker peak in the 15N-HSQC spectrum and are labeled with a lowercase letter. B) Graphical representation of results from CSI calculations using the Wutherich reference for Cα, Cβ, C, and N atoms: red circles at the top are chemical shifts consistent with helical structure; blue circles at the bottom are chemical shifts consistent with sheet structure; and gray circles at the center are for intermediate shifts. The cartoon illustrates one region of the Cx45CT (Q339-Q360) determined to be α-helical based on the CSI values.

