Fig 1.


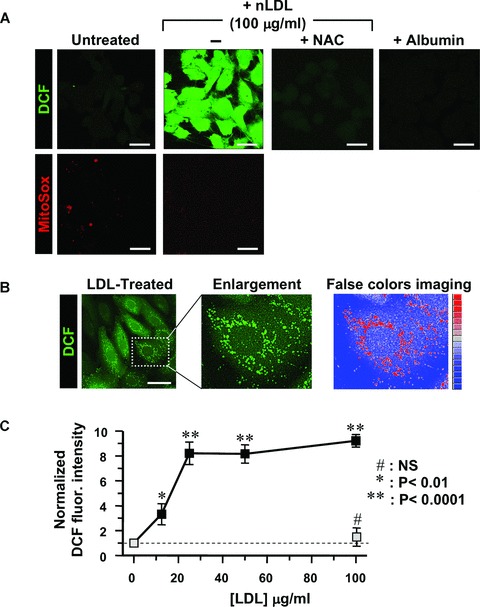
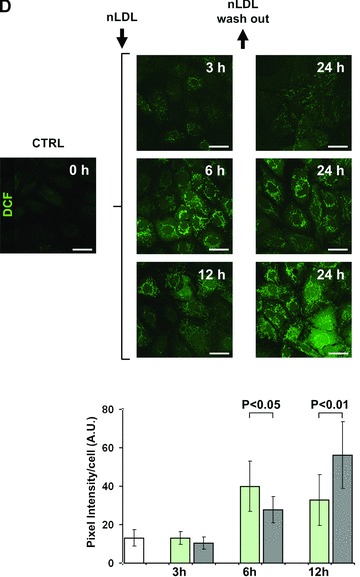
Treatment of HK-2 with nLDL results in unbalance of the cellular redox state. (A) LSCM for detection of H2O2 and mitochondrial O2− by the fluorescent probes DCF and MitoSox respectively. HK-2 cells were incubated for 24 hrs with 100 μg/ml nLDL alone or in the presence of 20 mM NAC or 15 mg/ml albumin. Untreated HK-2 cells were used as control. See Materials and Methods for details. Exciting Argon laser bean for DCF-related fluorescence was set at 5% of its maximal intensity and the PMT gain at 60%. Representative of at least four different preparations in each condition. (B) LSCM analysis of the DCF-related fluorescence and false-colours imaging. nLDL-treatment of HK-2 as in (A). The exciting Argon laser bean was set at 5% of its maximal intensity and the PMT gain at 30%. A false colors rendering of the enlarged detail was generated by ImageJ 1.38× (http://rsb.info.nih.gov/ij/). (C) Dose-dependence of DCF fluorescence. HK-2 cells were treated with the indicated concentrations of nLDL for 24 hrs and the DCF-related fluorescence recorded by LSCM as described in Materials and Methods. The fluorescence intensities of nLDL-treated HK-2 cells (black squares) were normalized to that of untreated cells and represent the average standard error of means (S.E.M.) of three independent experiments (n= 3) together with statistical analysis. The effect of NAC coincubation with 100 μg/ml of nLDL is also shown as light-grey square. (D) Effect of LDL wash-out on ROS production. HK-2 cells were treated with 100 μg/ml nLDL for 3, 6 and 12 hrs after that the cells were washed with a nLDL-free medium and maintained in culture for further 21, 18 and 12 hrs, respectively. Images of a representative experiment is presented showing the DCF-related fluorescence recorded before each nLDL wash-out and at 24 hrs from the beginning of the treatment. The histogram shows the quantitative analysis of the DCF fluorescence intensity. White bar, untreated cells; green bars, cell treated with nLDL for 3, 6 and 12 hrs; grey bars, cells incubated with nLDL for 3, 6 and 12 hrs, washed out and analysed after 24 hrs from the beginning of the treatment. Each bar is the average of three independent experiments ± S.E.M.; where indicated the statistical significance is shown. Bars inside all the micrographs: 30 μm.
