Fig 3.

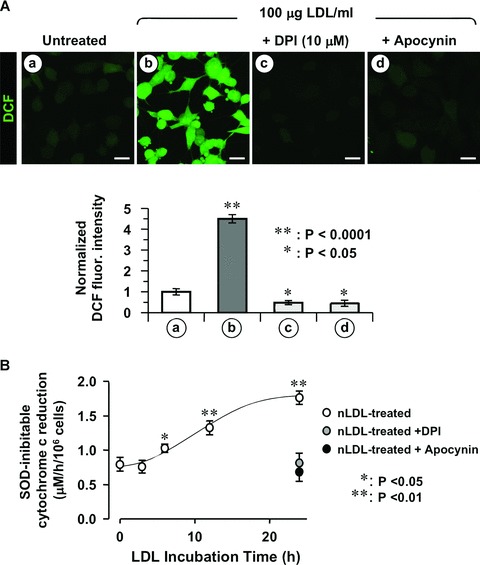
The nLDL-induced ROS production is sensitive to NOX inhibition. HK-2 cells were incubated for 24 hrs with 100 μg/ml nLDL alone or in the presence of either 10 μM DPI or 100 μM apocynin. (A) Upper panel: representative LSCM analysis of the effect of NOX inhibitors on nLDL-induced ROS production probed by the fluorescent probe DCF. Lower panel: quantitative analysis of the DCF fluorescence; each bar indicate the averages ± S.E.M. of n= 3. Statistical evaluation of the values measured in treated vs untreated cells is also shown. Bars inside all the micrographs: 30 μm. (B) NADPH oxidase activity assessed by the SOD-inhibitable cytochrome c reduction assay. See Materials and Methods for experimental details. The values are means ± S.E.M. of n= 3. Statistical evaluation of the values versus untreated cells, when significant, is also shown.
