Fig 4.


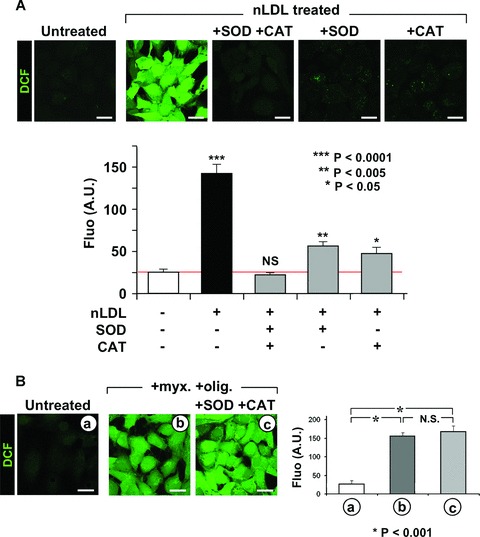
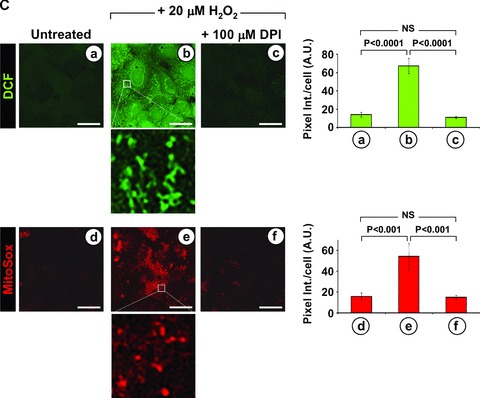
Extracellular ROS generation induces mitochondrial ROS production. (A) Effect of extra-cellular ROS scavengers on the nLDL-induced ROS production. HK-2 cells were incubated for 24 hrs with 100 μg/ml nLDL alone or supplemented with 500 U/ml SOD and/or 200 μg/ml catalase (CAT). Upper panel: representative LSCM analysis of the effect of SOD and/or CAT on the nLDL-induced ROS production probed by the fluorescent probe DCF (see Figure 1A and Materials and Methods). Lower panel: quantitative analysis of the DCF fluorescence; each bar indicate the averages ± SEM of n= 3. Statistical evaluation of the values measured in treated versus untreated cells is shown. (B) Effect of extra-cellular ROS scavengers on the mitochondrial ROS production induced by inhibition of the respiratory chain. HK-2 cells were treated for 2 hrs with 10 μM myxothiazol (myx) plus 1 μg/ml oligomycicn (olig) in the absence or in the presence of SOD + CAT (same concentrations as in panel (A)). ROS production probed by DCF is shown for a representative LSCM assay along with the statistical evaluation of the fluorescence intensity averaged ± S.E.M. from n= 3 for each condition. (C) Effect of externally added H2O2 on the intracellular ROS production. HK-2 cell were treated for 6 h with 20 μM H2O2 either alone or with 100 μM DPI. The intracellular H2O2 and intramitochondrial O2•− production was assessed by LSCM by DCF and MitoSox as described under Materials and Methods. Representative images of the LSCM analysis are show along with the statistical evaluation of the fluorescence intensity averaged ± S.E.M. from n= 3 for each condition. Enlargments showing subcellular compartmentalization of the DCF and MitoSox fluorescence are also shown for the H2O2-treated cells. Bars inside all the micrographs: 30 μm.
