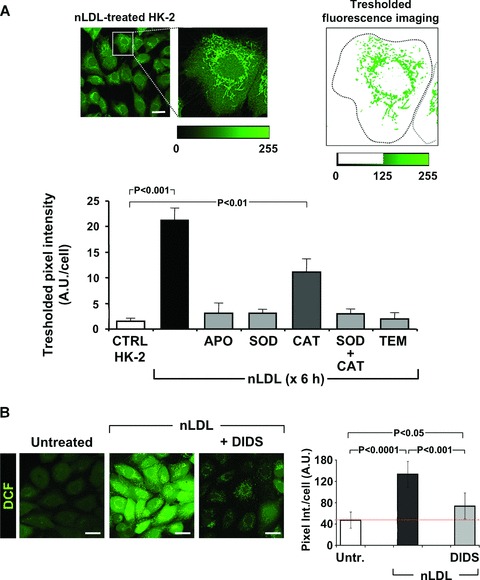
Fig 5.

ROS generated by NOX(s) are the primary triggers of the ROS-dependent mitochondrial ROS production. (A) Processing of LSCM image. HK-2 cells were treated with nLDL for 6 h and stained for hydroperoxide detection with DCF as described in Figure 1B and Materials and Methods. An enlargement of a representative optical field pinpointing a selected cell is shown along with the pixel intensity scale (from 0 to 255 a.u.) of the green channel. The image on the right shows the result obtained removing the pixels with intensity values below 125. The thresholded pixel texture was quantitated dividing its overall intensity by the cell surface. This procedure was applied to process at least 80–100 single cells from different fields per each experimental condition. The histogram shows the effect of the co-incubation of nLDL with each of the followings: 100 μM apocynin, 500 U/ml SOD, 200 μg/ml CAT, 500 U/ml SOD + 200 μg/ml CAT, 5 mM Tempol. Each bar is the average of three independent experiments ± S.E.M.; where indicated the statistical significance is shown. (B) Effect of DIDS on the intracellular ROS production. HK-2 cells were treated for 24 hrs with 100 μg/ml of nLDL either alone and in the presence of 200 μM DIDS after that the intracellular H2O2 production was assesses by LSCM by DCF. Representative images are shown along with the statistical evaluation of the fluorescence intensity averaged ± S.E.M. from n= 3 for each condition. Bars inside all the micrographs: 30 μm.
