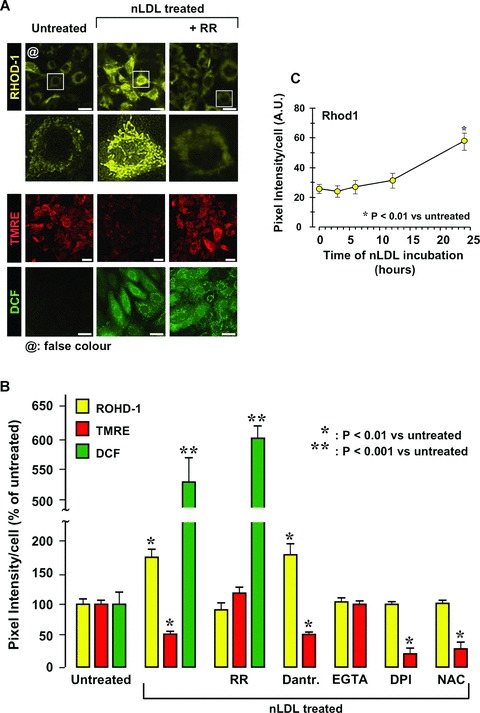
Fig 7.

Treatment of HK-2 with nLDL causes increase of mitochondrial Ca2+ uptake. (A) Effect of nLDL on the intramito-chondrial level of Ca2+. HK-2 cells were treated for 24 hrs with 100 μg/ml of nLDL either alone or in combination with 5 μM ruthenium red (RR). After that the intramitochondrial Ca2+, mtΔΨ and H2O2 production were assessed by the specific probes Rhod-1, TMRE and DCF respectively as detailed under Materials and Methods. The panel shows a representative LSCM imaging. To note, in order to improve visually the data presented, the original red fluorescence of Rhod-1 was digitally rendered in yellow (by ImageJ 1.38×, NIH, USA, http://rsb.info.nih.gov/ij/) without altering the pixel intensity scale. Enlargments of single cell imaging for Rhod-1-probed of untreated and nLDL treated samples are also shown. (B) Quantitative analysis of the mtCa2+-, mtΔΨ- and H2O2-probe fluorescence intensities from LSCM imaging. In addition to the experimental setting shown in (A) the effect of coincu-bation of nLDL with 10 μM dantrolene, 0.5 mM EGTA, 10 mM DPI, 20 mM NAC is also reported for mtCa2+-and mtΔΨ-changes. Each bar represents the fluorescence intensity/cell averaged ± S.E.M. from at least n= 3. The statistical differences versus untreated HK-2 cells is also indicated when significant. (C) Time-dependence of the mtCa2+ changes as a function of the nLDL-incubation time. The Rhod-1-related fluorescence intensity for each time-point was measured as in (A, B) and refers to the average ± S.E.M. of n= 3. Bars inside all the micrographs: 30 μm.
