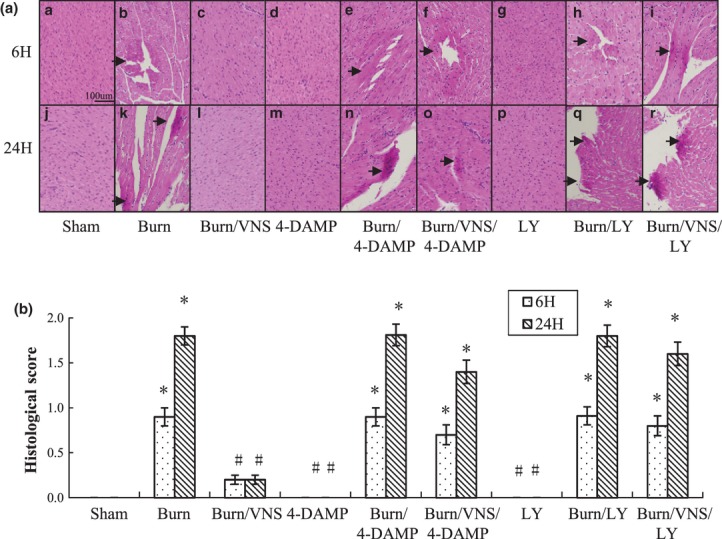
Fig. 1.

Histological analysis of heart tissue in experimental groups. Heart tissue sections (n = 5 per group) were stained with haematoxylin and eosin and viewed by light microscopy (A). (a–i) Specimens obtained at 6 hrs after burn. (j–r) Specimens obtained at 24 hrs after burn. Black arrow shows early necrosis. Heart injury was scored on a scale of 0 (normal) to 2 (severe) by a pathologist blinded to the experimental groups (B). Images acquired at 40 × magnification. Black bar = 100 μm. *P < 0.01 versus Sham; #P < 0.01 versus Burn.
