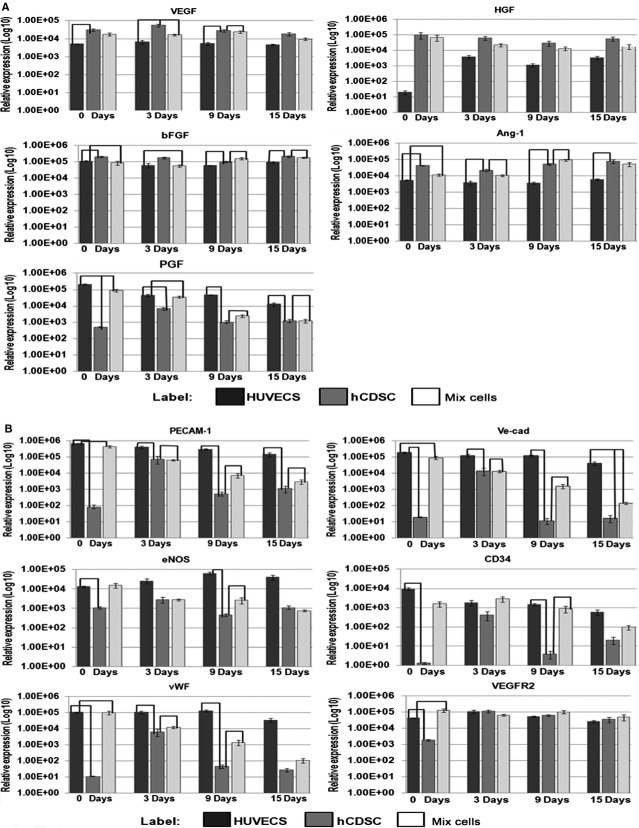
Fig. 3.
(A) Relative angiogenic genes expression level in HUVECS, hCDSC and the mix culture of HUVECS-hCDSC on day 0, 3, 9 and 15. The line indicate significant difference between two groups (P < 0.05 and n = 6). (B) Relative endogenic genes expression level in HUVECS, hCDSC and mix culture of HUVECS-hCDSC on day 0, 3, 9 and 15. The line indicate significant difference between two groups (P < 0.05 and n = 6).

