
Fig 1.
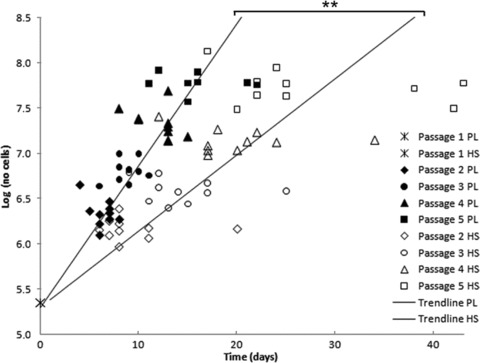
Duplication rates, starting at 225,000 cells, expressed as log(number of cells) for cells cultured in PL and HS for 10 patients. The time in days and number of cells per cell isolation are indicated. The PL cells are depicted by the filled symbols and the HS cells with the clear symbols, including a different symbol per passage. The regression lines with the averaged slope are also shown in the figure. The averaged slope of PL cells was significantly steeper than for the HS cells (P < 0.01).