
Fig 3.
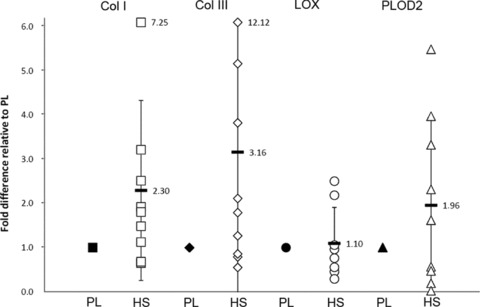
Fold-change of target genes in cells cultured in presence of HS (mean ± S.D.), when normalized for cells cultured in presence of PL. LOX expression is comparable between groups, but collagen types 1 and 3 and PLOD2 expression tend to be higher in cells cultured in HS, although differences are not significant due to large interpatient variations.