
Fig 4.
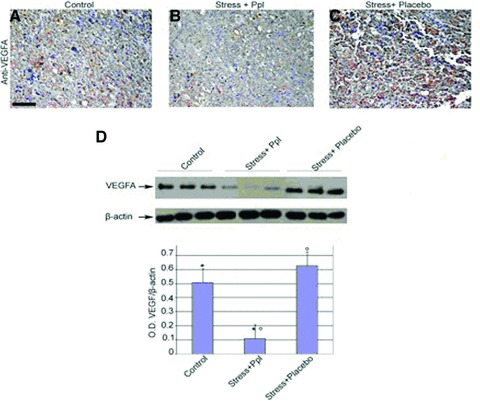
VEGFA expression in stressed mice. Melanoma sections from control and stressed mice were obtained and VEGFA levels were analysed by IHC. Protein lysated from the sections were obtained and VEGFA content was analysed by Western blotting. An anti–β-actin antibody was used as loading control (upper panel). Graphical representation of VEGFA/β-actin ratio in control and stressed mice (lower). Data are represented as the mean ± S.E.; (n= 3) *P= 0.01 versus ctrl and stress + Ppl; (n= 3) °P= 0.002 versus stress + placebo and stress + Ppl. Densitometry analysis was obtained from samples of two separate experiments. Scale bar: 100 μm in A–C. Ppl: propranolol.