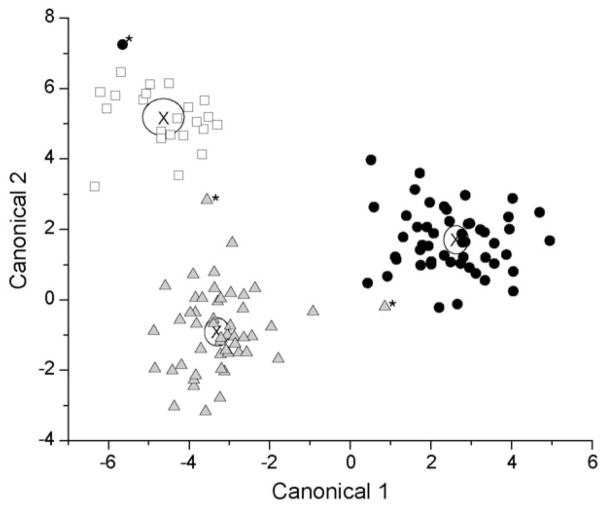
Figure 3.
Linear discriminant analysis of urinary organic acids by study group. Control (□), CBZ (
 ), and VPA (●) group means were significantly discriminated with a Wilks’ Lambda test (p<0.0001) and a 2.4% misclassification rate. Misclassified samples were labeled by *. “X” denotes the center of each cluster.

