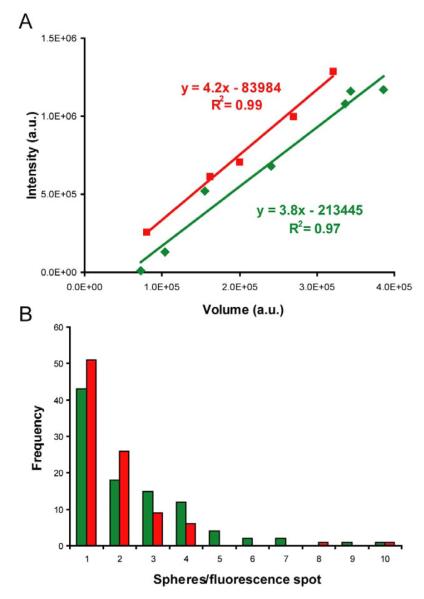
Figure 2.
Linear correlation between fluorescence intensity and particle volume. A) Volume in arbitrary units (a.u.) [6] versus integrated fluorescence intensity (also in a.u.) [23] coming from the same regions were plotted and analyzed by regression fit. The red and green lines and squares represent data from individual particles red fluorospheres and green fluorospheres, respectively. Note that some particles are smaller than complete fluorospheres and some represent more than one sphere, in the range of particle sizes shown here. B) Fluorescence intensity distribution of the spheres. Intensity bin size equivalent to fluorescence from one fluorosphere (volume 1.9 ± 1.2×10⁵ a.u, N=22), representing 3.5×10⁵ a.u. (green) and 8×10⁵ a.u. (red). Nred = 95, Ngreen = 99.

