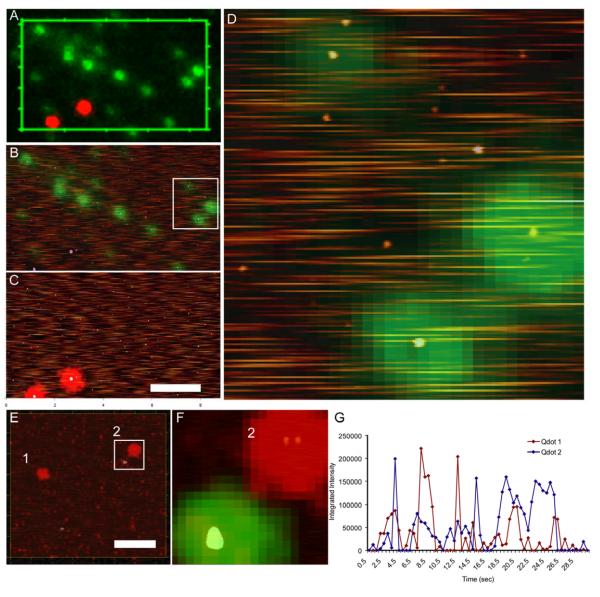
Figure 3.
Fluorospheres as molecular fiduciary markers. A) Optical image showing red fluorospheres and green quantum dots. B) Green channel picture from the selected region in A and height images overlaid. C) Red channel picture from the same region and height images overlaid. D) Enlarged area from white rectangle in B. E) Green fluorospheres and red quantum dots: height image and red fluorescence channel overlaid. Qdots analyzed in panel G are labeled by numbers 1 and 2. F) Zoomed region from panel E; height image and fluorescence channels overlaid showing the double nature of one specific red fluorescent spot (labeled 2). G) Time traces of Qdot655 fluorescence. Total pixel intensity in regions around the indicated two red dots in panel E (1 and 2) were measured from 60 frames acquired for 500 ms each in a total time of 30 seconds. Scale bar 2μm.

