Figure 3.
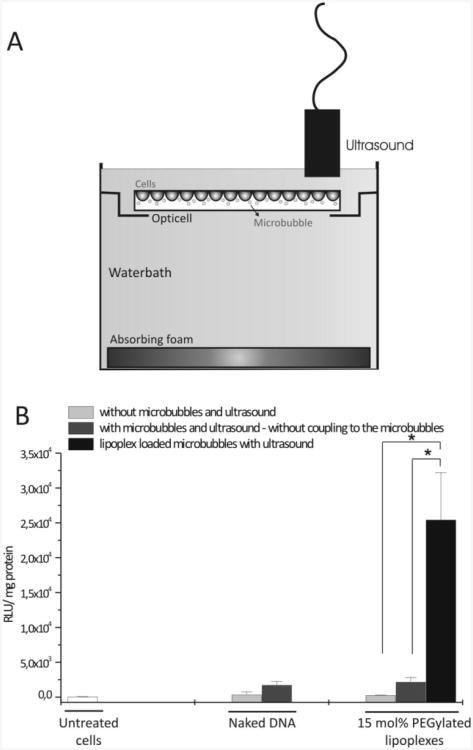
Figure 2. (A) Schematic representation of the experimental setup. Cells were grown on one side of an Opticell unit. For ultrasound exposure, Opticell plates were turned upside down. In this way, microbubbles were able to rise against the cell layer. (B) The transfection efficiency of lipoplex loaded microbubbles in the presence of ultrasound (black bars) compared to the transfection efficiency of naked DNA and free 15 mol % PEGylated lipoplexes in the absence (light gray bars) and presence of microbubbles and ultrasound (dark gray bars). The background luciferase signal in untreated cells is also shown (white bars). The transfection results, i.e., the extent of luciferase expression, are expressed as RLU (RLU: relative light units) per mg protein. *p < 0.05. Reprinted with permission from [56]. Copyright (2009) American Chemical Society.

