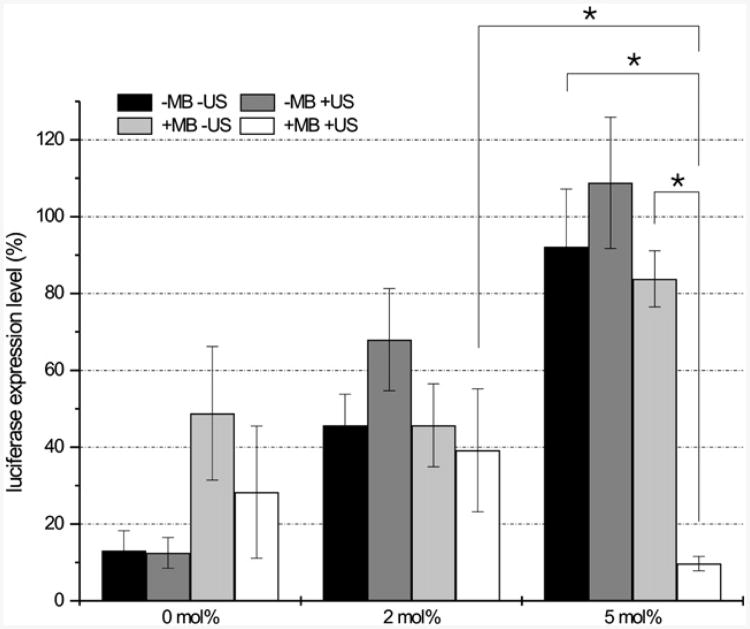
Figure 4.
Silencing efficiency of free siPlexes and PEG-siPlexes in the absence and presence of ultrasound, and PEG-siPlex loaded microbubbles in the presence of ultrasound. The PEGylation (DSPE-PEG2000-biotin) degree of the siPlexes is represented in the x-axis. The black and the dark grey bars represent the gene silencing efficiency of free siPlexes in the absence and presence of ultrasound, respectively. The light grey and white bars represent the gene silencing of the siPlexes loaded on the microbubbles in the absence or presence of ultrasound. In all cases, the following ultrasound settings were used: 1 MHz, 10% DC, 2W/cm2, 10 s. The results are expressed as percentage of luciferase expression compared to mock siRNA transfected cells. The asterisks (*) represent significant differences with p<0.05. (MB = microbubble; US = ultrasound). Reprinted from Journal of Controlled Release, 126/3, Vanderbroucke RE, Lentaker I, Demeester J, De Smedt SC, Sanders NN, “ Ultrasound assisted siRNA delivery using PEG-siPlex loaded microbubbles”, 265-273, (2008), with permission from Elsevier.

