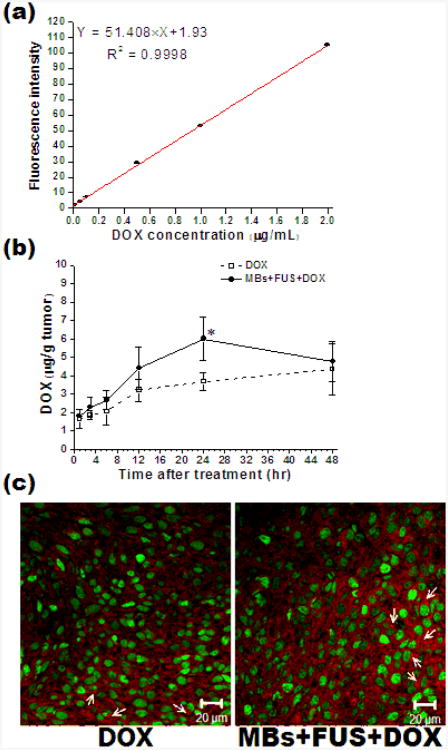
Figure 7.
Accumulation of DOX in the tumor tissues at 1, 3, 6, 12, 24 and 48 h after treatments. (A) shows the calibration curve illustrating the relationship between DOX concentration and fluorescent intensity at 582 nm; (B) shows the DOX extracted from the tumor tissues treated with DOX or MBs+FUS+DOX (5mg/kg of DOX injected and *P<0.05 at 24 h after treatments); (C) representative fluorescent images showing the DOX deposition (red, white arrow) related to CD31-stained blood vessels (green) at 24 h after treatments (magnification: 400×). N = 3 for each case. Reprinted from Nanomedicine: Nanotechnology Biology and Medicine, Lin C-Y, Li J-R, Tseng H-C, Wu M-F, Lin W-L , “Enhancement of focused ultrasound with microbubbles on the treatments of anticancer nanodrug in mouse tumors”, 1-8, (2011), with permission from Elsevier.

