
Fig 2.
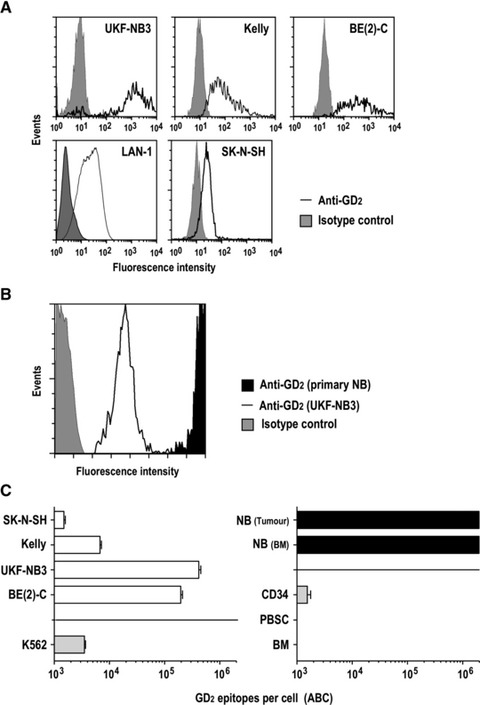
Surface expression of GD2 on established and primary NB cells. (A) Expression of GD2 on established human UKF-NB3, Kelly, BE(2)C, LAN-1 and SK-N-SH NB cells was determined by flow cytometry using PE-Cy5-labelled GD2-specific mAb 14.G2a (open areas). Control cells were treated with isotype control (grey areas). (B) To illustrate high level expression of GD2 on primary cells, BM with NB cells from a relapsed patient was mixed with established UKF-NB3 NB cells before analysis by flow cytometry as described in (A). (C) For quantification of GD2 molecules on the cell surface, antigen expression was measured as ABC molecules/cell as described in the methods section. GD2 expression on established NB cell lines (left panel, open bars), K562 erythroleukaemic cells (left panel, shaded bar), primary cells from an NB tumour metastasis (NB tumour) and BM infiltrating NB cells (NB BM) (right panel, filled bars) as well as haematopoietic cells (selected 34+ cells, CD34; lymphocytes from peripheral blood, PBSC; lymphocytes from bone marrow, BM) from healthy donors (right panel, shaded bars) is indicated. The graphs are shown with a logarithmic scale. Lower and upper detection limits of this assay were 1 × 10³ and 2 × 10⁶ ABC molecules/cell, respectively. Data are represented as mean ± S.D.