
Fig 4.
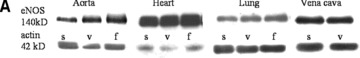
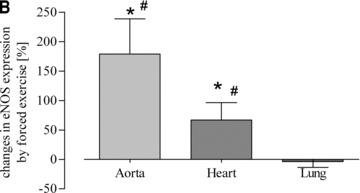
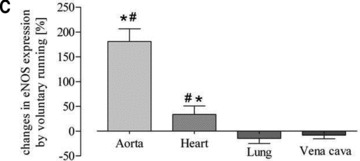
Quantitative evaluation of eNOS protein expression in the aorta, heart, lung and vena cava. (A) Representative Western blot of aorta, heart, lung and vein homogenates from sedentary controls (s), forced exercise (f) and voluntary running mice (v); (B) quantitative evaluation of Western blot signals following forced exercise (*P= 0.0012 versus control) and (C) voluntary running (*P < 0.0001 versus control). Sedentary controls (bars not shown) were set to zero (#P < 0.05 versus lung and vein).