
Fig 1.
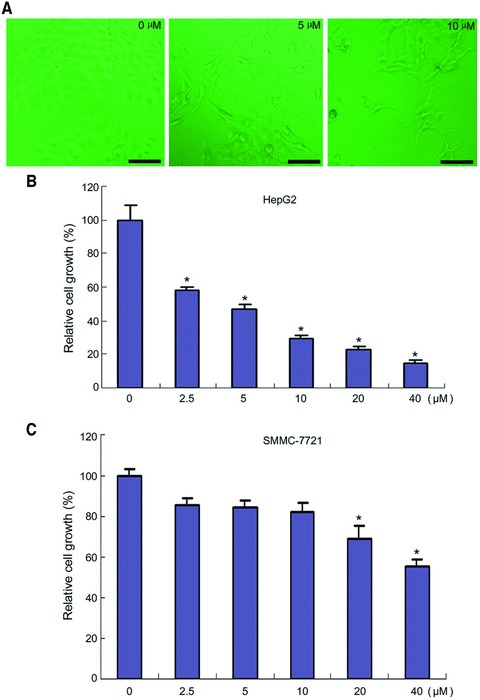
Inhibition of hepatoma cells growth by chrysin. (A) HepG2 cells were treated with chrysin at the indicated dosages for 48 hrs. The cells were observed under a phase-contrast microscopy. Bar: 100 μM. (B) HepG2 cells were seeded in a 96-well plate at 5000 cells per well. The next day, the cells were treated with chrysin at the indicated dosages for 48 hrs. Cell viability was assessed by CCK-8 assay. The relative cell growth was plotted. Cell viability in vehicle-treated group was set as 100%. Points: mean of four replicates; bars: S.E. *P < 0.05 versus control. (C) SMMC-7721 cells were seeded in a 96-well plate at 5000 cells per well. The next day, the cells were treated with chrysin at the indicated dosages for 48 hrs. Cell viability was assessed by CCK-8 assay. The relative cell growth was plotted. Cell viability in vehicle-treated group was set as 100%. Points: mean of four replicates; bars: S.E. *P < 0.05 versus untreated control. A representative of three experiments was shown.