
Fig 7.
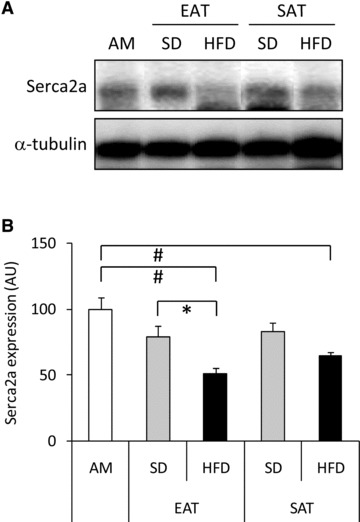
Effect of CM from EAT and SAT on SERCA2a expression. Lysates prepared from rat cardiomyocytes incubated with control AM or CM (diluted 1:4) from EAT and SAT from SD- and HFD-fed guinea pigs for 24 hrs were analysed by Western blotting for SERCA2a- and α-tubulin expression. Representative Western blots (A) and quantitative analysis (B) are also shown. Open bars: AM; grey bars: CM from SD-fed animals; black bars: CM from HFD-fed animals. Data are expressed as mean ± S.E.M. (n= 3 per group). Differences between the experimental groups were calculated by one-way anova and unpaired Student’s t-tests. #P < 0.05 versus AM; *P < 0.05 HFD versus SD.