
Fig 2.


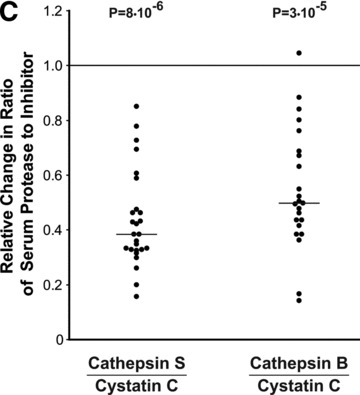
Modulation of cathepsin and cystatin expression by GC therapy in PBLs and serum during the MS relapse. (A) Relative RNA expression levels before and at day 7, following a 6 day IV course of GC treatment were quantified by 2−ΔΔCT values, n= 27 (except for CSTB n= 26). (B) Serum protein levels in day 7 following therapy initiation are depicted relative to pre-treatment values at relapse for cathepsin S (n= 26), pro-cathepsin B (n= 23), cystatin C (n= 26). (C) Changes in the ratios between the proteases and the inhibitor cystatin C in the serum following GC treatment. Horizontal bars: median of fold changes of post-treatment relative to pre-treatment ratios.