
Fig 4.
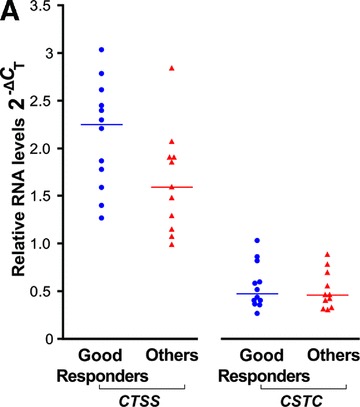
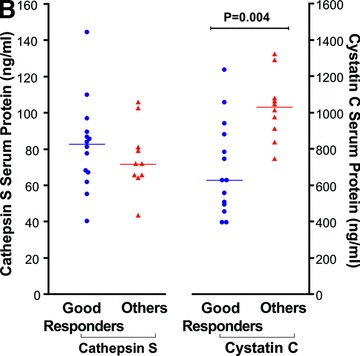
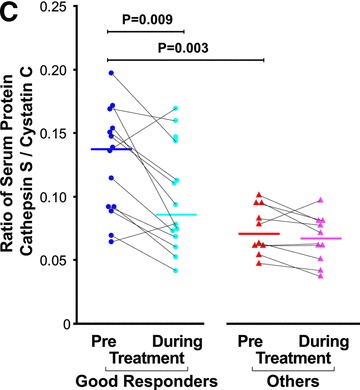
Response phenotype to IFN-β treatment and cathepsin S and cystatin C expression levels. IFN-β treated MS patients were stratified according to their response phenotype. (A) CTSS and CSTC pre-treatment levels relative RNA levels depicted as 2−ΔCT values, compared between ‘good responders’ (blue circles, n= 12) and ‘others’ patient groups (red triangles, n= 11). (B) Serum cathepsin S and cystatin C pre-treatment levels assessed by ELISA in ‘good responders’ (n= 14) and the ‘others’ patient groups (n= 10). (C) Serum cathepsin S to cystatin C ratios in ‘good responders’ (n= 14) and ‘others’ patient groups (n= 10); values prior to IFN-β therapy and 3–6 months after therapy initiation are connected by lines.