
Fig 3.
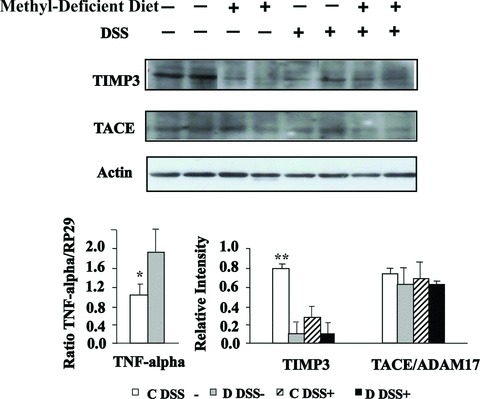
Effects of MDD on expression levels of TNF, TIMP3 and TACE in DSS-induced colitis in rats. Western blot analysis of TIMP3 and TACE expression (top and bottom right) and mRNA level of TNF determined by semi-quantitative real time RT-PCR, using PR29 as reference gene (bottom left). *TNF of C DSS− compared with D DSS−, P < 0.05; **TIMP3 of C DSS− compared with either D DSS−, C DSS+ or D DSS+, P < 0.01.