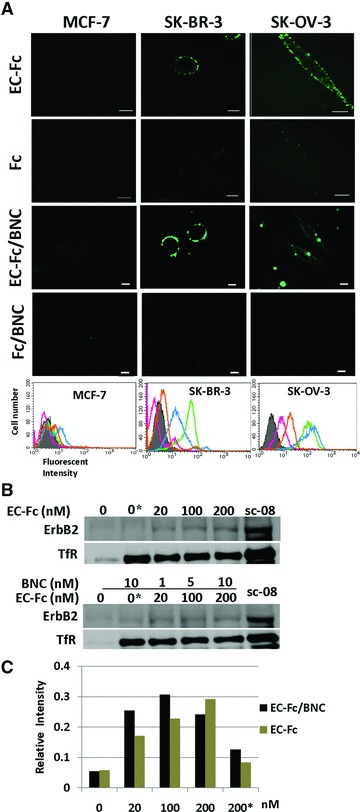
Fig 4.

Evaluation of ErbB2 internalization in SK-BR-3 cells treated with EC-Fc/BNC. (A) Comparison of EC-Fc/BNC bound to the surface of the cells over expressing ErbB2. Cells were incubated with EC-Fc (1 μM), Fc (1 μM), EC-Fc/BNC (40 nM/2 nM), and Fc/BNC (40 nM/2 nM) for 1 hr at 37°C in MCF-7 cells, SK-BR-3 cells, and SK-OV-3 cells. MCF-7 cells were used as the control for low ErbB2 expression. The cells were stained with anti-human IgG labelled with FITC. Bars depict 10 μm. The treated cells were also subjected to flow cytometoric analysis for the surface bound fraction of EC-Fc and Fc ligand with and without BNC in MCF-7, SK-BR-3 and SK-OV-3, respectively. Untreated cells were shown in shadow (grey). Treatment with EC-Fc ligand Fc ligand, EC-Fc/BNC and Fc/BNC was marked as green, magenta, blue and orange, respectively. (B) SK-BR-3 cells were treated with different concentration of EC-Fc or Ec-Fc/BNC. The cell surface receptors were reversibly biotinylated with NHS-SS-Biotin and were incubated with EC-Fc, Fc, EC-Fc/BNC or Fc/BNC for 2 hrs at 37°C. SK-BR-3 cells left untreated at 4°C for 2 hrs were shown as lane ‘0’. ‘0*’ corresponds to the cells treated with Fc ligand (top) and Fc/BNC (lower) at a concentration of 200 nM, respectively. After the treatments, cells were lysed, immunoprecipitated with avidin agarose and were subjected to Western blot to detect ErbB2 with anti-ErbB2 antibody. sc-08 antibody treatment was taken as positive control for endocytosis of ErbB2. Transferrin receptor (TfR) was monitored as an internal control for the experiments. (C) The bands from the Western blots were densitometrically analysed with ImageJ and the intensity each band was normalized by the intensity when treated with antibody sc-08.
