
Fig 11.
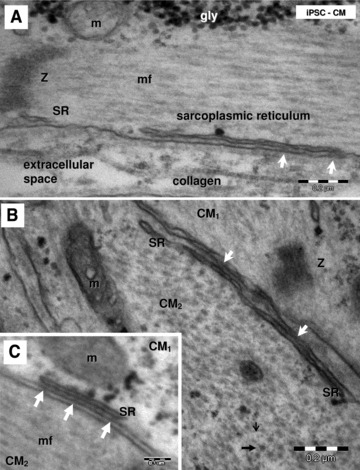
Electron micrographs (A–C) show peripheral couplings or ‘Ca2+ release units’ in HFK-iPSC-CM visible as small dense structures (white arrows) between peripheral sarcoplasmic reticulum (SR) and plasmalemma. Longitudinally (A) and transversally (B) sectioned myofilaments. Thin (small black arrow) and thick (thick black arrow) myofilaments are visible in the transverse section (B). Z: Z bands; gly: glycogen; mf: myofilaments; m: mitochondria; CM1 and CM2: indicates that these are different adjacent cardiomyocytes.