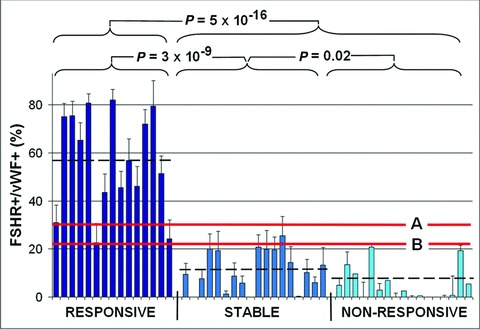
Fig 2.

The ratio between the density of the vessels that show a FSHR signal and vessels positive for von Willebrand factor (vWF) is correlated with the response of the patients to subsequent treatment with sunitinib. The bars correspond to 15 patients who responded to the treatment, 18 patients who were stable and 17 patients who did not respond. Errors bars: standard errors of the means computed for 20 microscopic fields for each patient. The three thick horizontal lines correspond to the averages for the three groups of patients (56.8 ± 5.4%, 11.4 ± 2% and 7.3 ± 0.7% for the responsive, stable and non-respective patients, respectively. The lines marked A and B correspond to the two thresholds (31% and 23%, respectively) used for the points A and B in Figure 3 to determine the sensitivities and the specificities of discriminating between the patients who are responsive versus the combined stable or non-responsive set.
