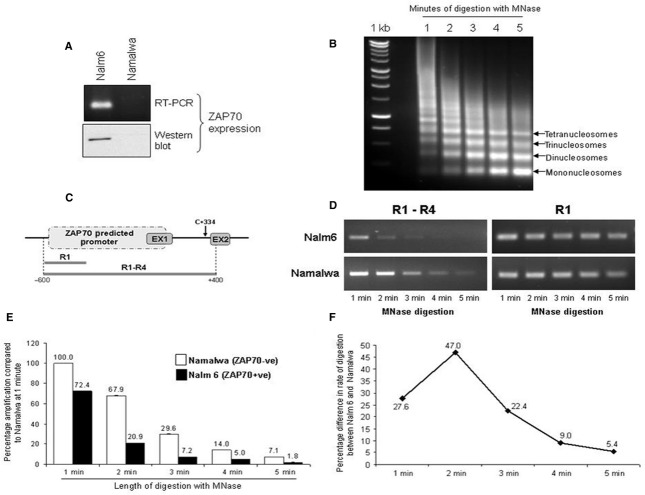
Fig 4.
Differential global chromatin folding and accessibility in ZAP70+ versus ZAP70− cells. (A) Western blot and RT-PCR for detection of ZAP70− total RNA were prepared from Nalm6 and Namalwa cell lines and used for qRT-PCR detection of ZAP70 (top panel); 30 μg whole cell extract was separated by SDS-PAGE and immunoblotted for ZAP70 (bottom panel). Gels shown are representative of tri-replicate experiments. (B) Native chromatin was isolated from Namalwa or Nalm6 cell lines and digested with micrococcal nuclease for 5 min. with a sample taken every minute. DNA was isolated using phenol–chloroform extraction and separated on 1% agarose gel. (C) Schematic representation of ZAP70 predicted promoter sequence and the position of the primers used to amplify the 1 kb fragment (R1–R4) or the small control fragment (R1). (D) 20 ng of DNA from chromatin digests sampled at 1 min. intervals was used in RT-PCR reactions using ZAP70 R1 sense and ZAP70 R4 antisense primers to amplify R1–R4 fragment (1 kb) or ZAP70 R1 sense and antisense to generate R1 control fragment (200 bp). (E) The R1–R4 amplification as outlined in (C) was carried out using quantitative PCR and values plotted onto a graph ±S.E.M. (n = 3). (F) Difference between the rate of digestion between Nalm6 and Namalwa chromatin were calculated using the ratio between percentage amplification of R1–R4 product in two cell lines at a given time interval.

