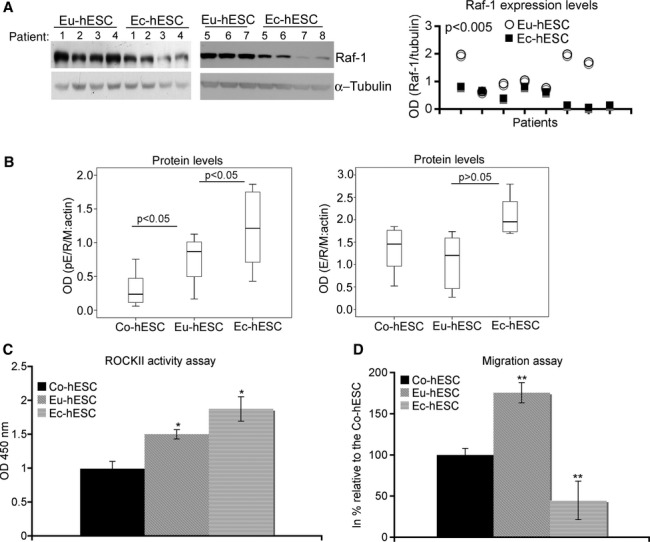
Fig 3.

Cellular Raf-1 levels determine hESC motility. (A) Western blot analysis of Raf-1 expression levels in individual hESC cultures (numbered at the top of the immunoblot and corresponding to the sample ID number given in Table S1 (for Ec-hESC; n = 7) and in [25] for Eu-hESC; n = 7) is shown on the left and the graphical representation of the analysis on the right. The level of the protein is shown as optical density (OD) of the Western blot lanes normalized to the OD of α-tubulin. (B) Box plots of the data obtained using Western blot analysis pE/R/M (left panel; n = 8 per group) and total E/R/M levels (right panel; n = 8 per group) in Co-, Eu- and Ec-hESC are given. The levels of the proteins are shown as OD of the Western blot lanes normalized to the OD of β-actin. The corresponding P-values obtained after anova and Post hoc analysis are additionally inserted on the top of the box plots. (C) The ROCK II activity in Co-, Eu- and Ec-hESC is shown as average values of absorbance (OD 450 nm) determined in six biological replicates (mean ± S.D.) and normalized to the absorbance in Co-hESC. The statistical analysis of the data was performed with anova followed by Post-hoc test, *P < 0.05. (D) The analysis of cell migration in Co-, Eu- and Ec-hESC is given in per cent as average values of migrating cells from biological triplicates relative to that in Co-hESC (mean value set to 100%).
