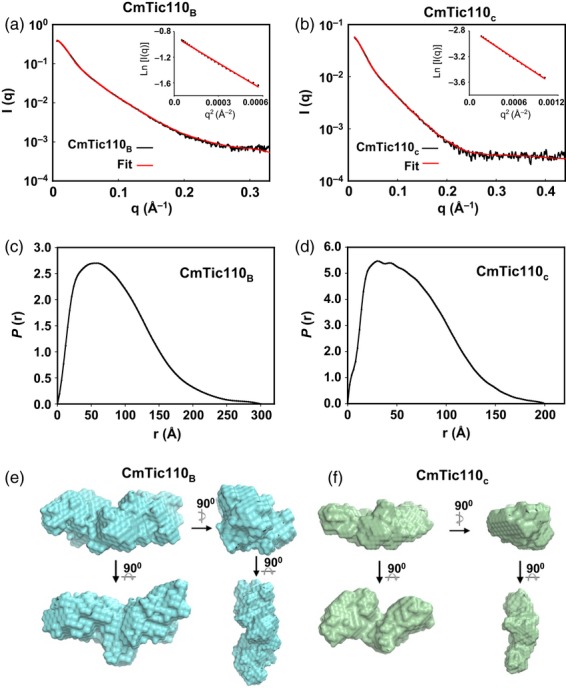
Figure 4.

Small-angle X-ray scattering (SAXS) characterizations of CmTic110B and CmTic110C. (a, b) Experimental X-ray scattering curves (black line) and the theoretical fitting curves (red line) of CmTic110B and CmTic110C were generated with gnom. The insets show the Guinier plots. (c, d) The distance distributions of CmTic110B and CmTic110C. (e,f) Averaged low-resolution envelope obtained from 10 independent ab initio models of CmTic110B and CmTic110C derived from the SAXS data.
