Figure 5.

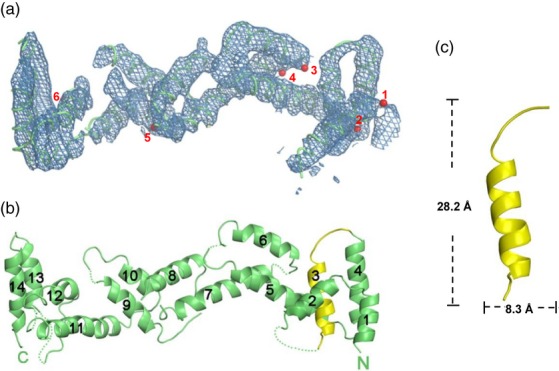
Structure of CmTic110C. (a) Electron density map of experimental phase at 1.5σ and model building of CmTic110C based on the six selenium sites (red balls 1–6 for selenium in Met917, Met940, Met1017, Met1020, Met1051 and Met1212, respectively). (b) A ribbon drawing of the CmTic110C structure. Helix 3 and part of the loop connecting helix 4 (indicated in yellow) is the corresponding region of TM6 in model 1 shown in Figure 1(a). (c) A close-up view of the region corresponding to TM6 and its dimensions. All the figures were generated with pymol (http://www.pymol.org/).
