6.

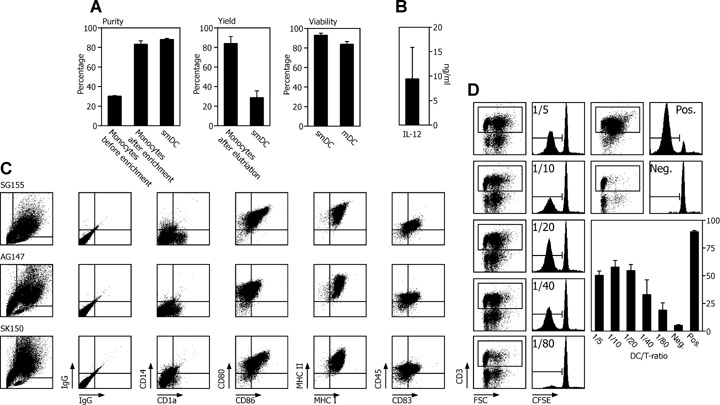
Validation of the DC manufacturing process for three patients. DC quality control of cancer vaccines from three cancer patients using monocytes enriched by elutriation was performed according to the flow chart shown in Fig. 1A. For DC activation, 30 ng/ml LPS was used. (A) Purity, yield and viability ± SEM was assessed for monocytes, smDCs and mDCs as indicated. (B) Mean ± SEM of IL-12 secreted from three vaccines. (C) Immune phenotype measuring the expression density of the depicted DC membrane molecules for three patients. (D) AlloMLR using CFSE dilution was performed as potency assay for the stimulatory capacity of smDCs at the indicated DC/PBMC ratios. The dot plots illustrate the gating for proliferating CD3 expressing T lymphocytes that lost CFSE due to proliferation as shown in the histograms. As a negative control we used un-stimulated PBMCs, as positive control PBMCs exposed to the super-antigen SEA/SEB (one representative experiment of three is given). The bar graph shows the mean ± SEM of the percentage of proliferating allogeneic T lymphocytes co-cultured with DCs from three patients.
