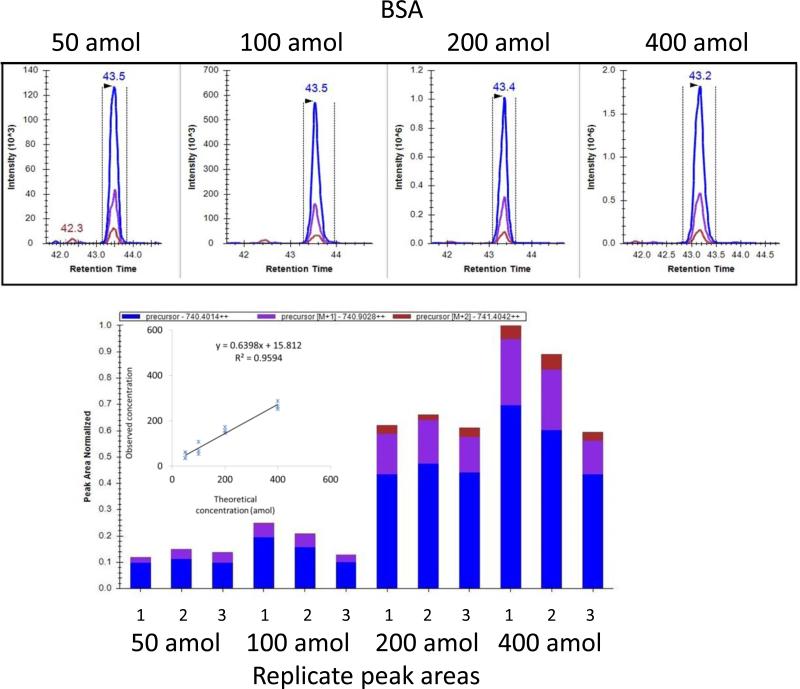
Figure 2.
Reproducible peak area and retention times and good correlation between peak area and concentration are observed for peptides from BSA. Tryptic digest peptide mixtures were analyzed by LC-MS/MS on the LTQ-Orbitrap Elite mass spectrometer where MS1 spectra were acquired in high-resolution FT mode. Skyline extracts and displays MS1 intensity values for M (blue), M+1(purple) and M+2 (red) precursor ions at varying concentrations from a single run in the upper panel and integrates peak area in the selected retention time window for triplicate runs at four concentrations (50-400 amol) in the lower panel for LGEYGFQNALIVR. The correlation coefficient (R2) is calculated based on the average of triplicate runs using the peptides HLVDEPQNLIK and LGEYGFQNALIVR. The regression line demonstrates that the linear range extends to the attomole level.

