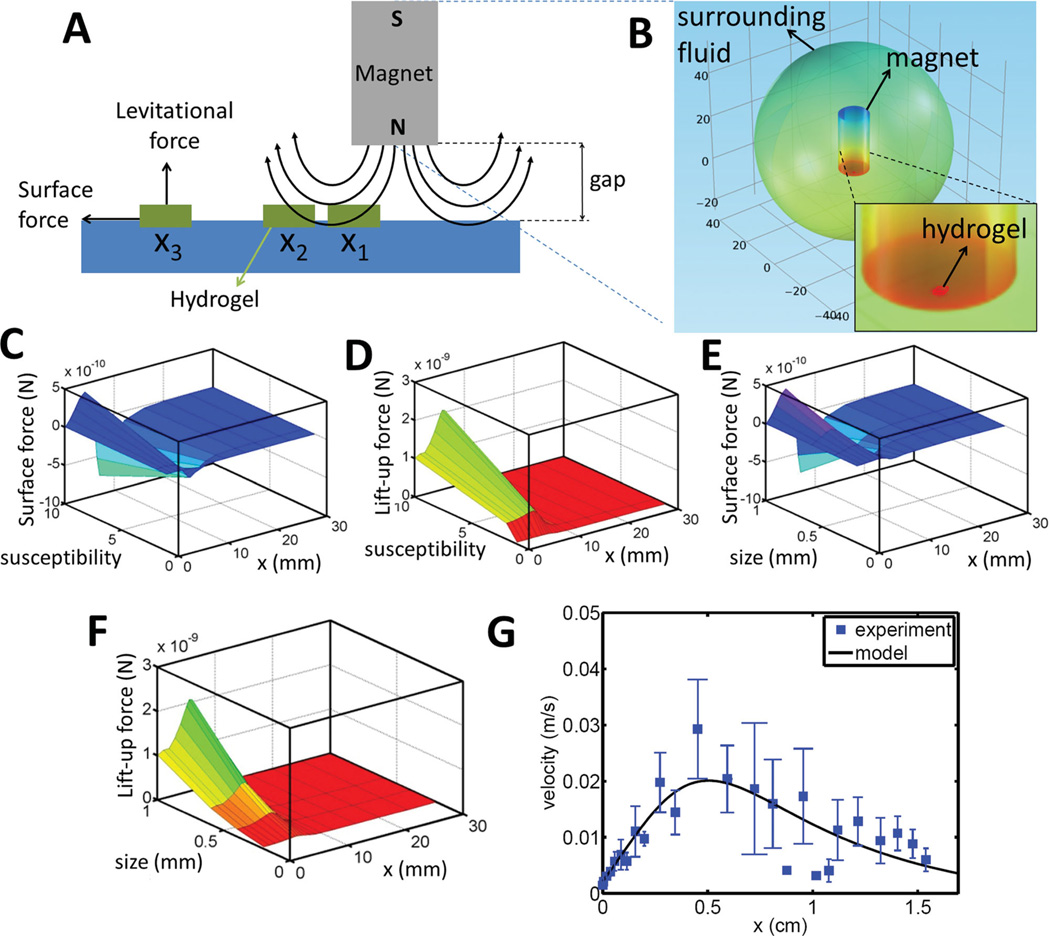
Figure 2.
(A) Schematic for the motion of a hydrogel (1 mm × 1 mm × 200 µm) under a magnetic field. (B) Contour plot of magnetic potential. (C) Surface and (D) Levitational magnetic forces as a function of hydrogel susceptibility and horizontal “x” location. (E) Surface and (F) Levitational magnetic forces as a function of characteristic length of a hydrogel and horizontal “x” location. (G) Validation of hydrogel motion as a function of time (squares represent experimental data (n = 10) and solid line represents the model fit).

