Figure 5.
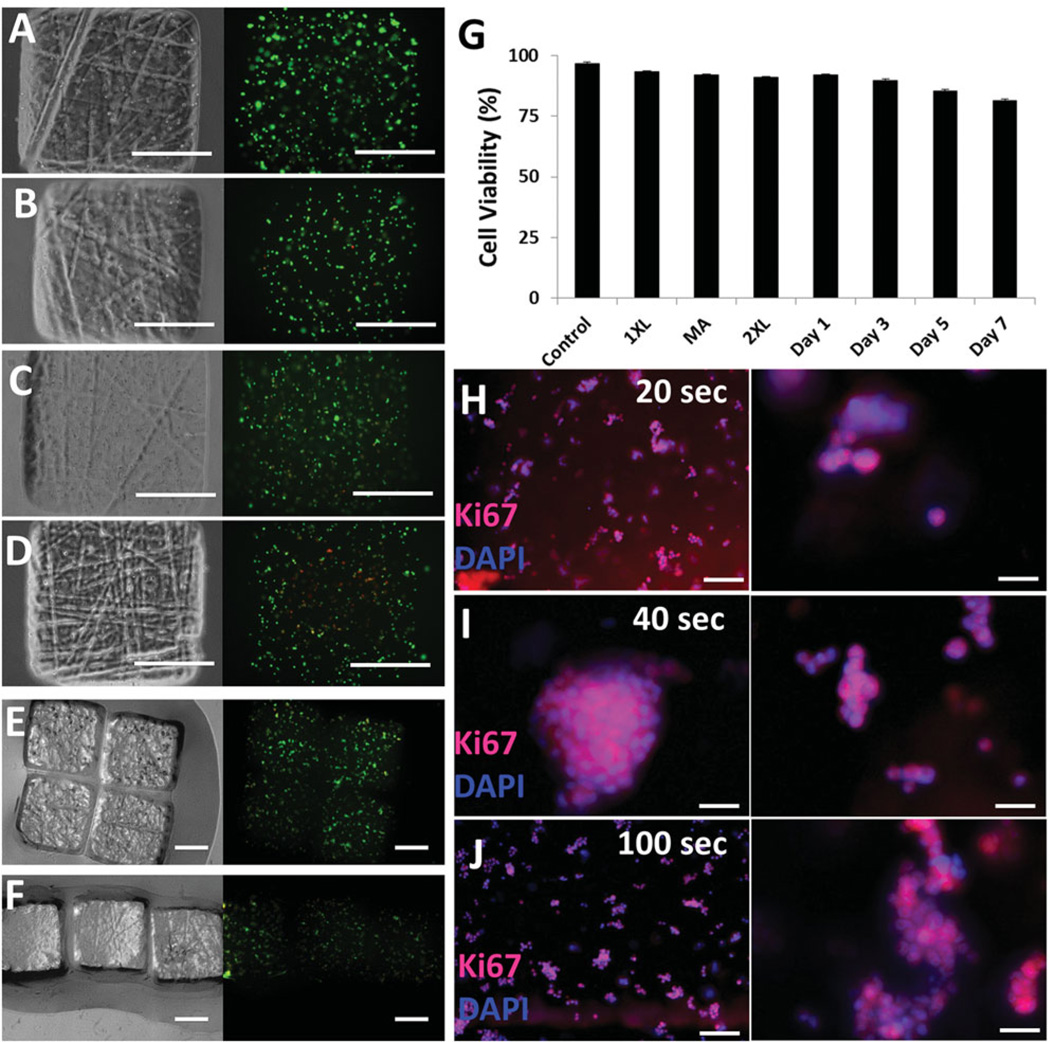
Cell viability in hydrogels. Phase contrast and fluorescence images of NIH 3T3 cell encapsulating hydrogels at time points after fabrication: (A) t = 24h, (B) t = 48h, (C) t = 72 h, and (D) t = 168h. (E and F) Phase-contrast and fluorescence images of cell encapsulating assembled hydrogels. Green represents live cells and red represents dead cells. (G) Quantification of cell viability after each step to form hydrogels. XL, 2XL, and MA stand for crosslinking, second crosslinking, and magnetic assembly, respectively. Cells were cultured for seven days. Quantification of samples (n = 8) at each time point demonstrated that viability did not significantly decrease due to UV and applied magnetic field. Scale bars are 500 µm. Error bars represent standard error of the mean. (H–J) Immunocytochemistry of proliferating cells stained with Ki67 and DAPI. (H) 20 s UV photo-crosslinking, (I) 40 s UV photo-crosslinking, (J) 100 s UV photo-crosslinking. Right column images are magnification of corresponding adjacent experimental condition. Scale bars for H and J are 100 µm. Scale bar for I is 70 µm. Scale bars for the magnified images presented on the right column are 50 µm.

