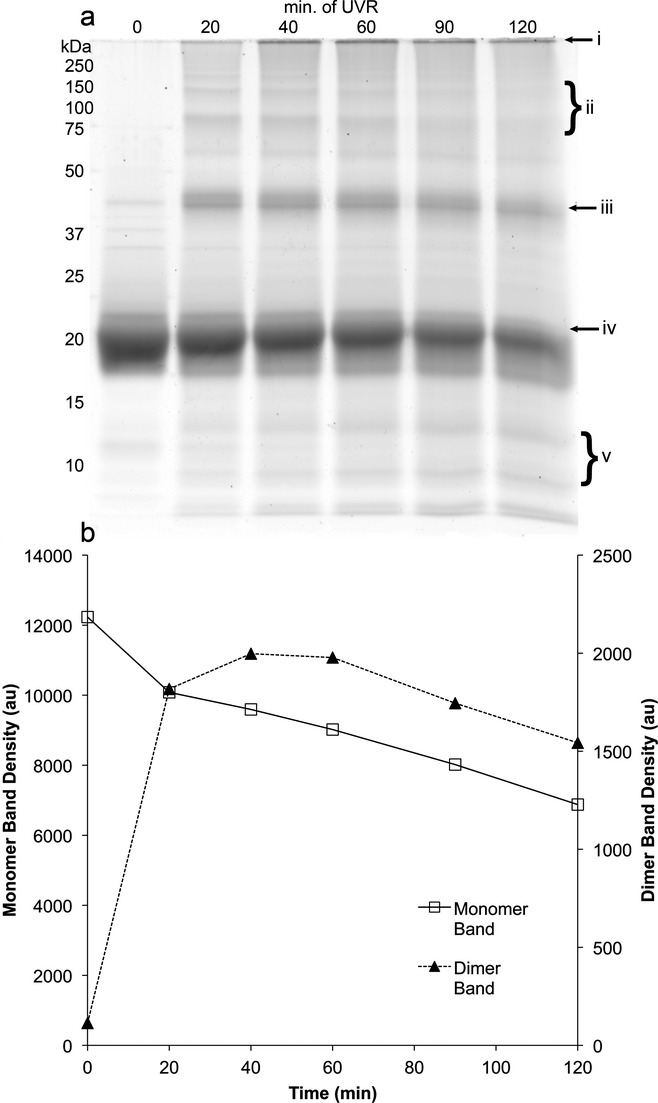
Figure 5.

(a) Scanned image of a krypton-stained gel from SDS-PAGE of ultraviolet radiation (UVR)-induced aggregate samples from a 1 mg mL−1 wild-type HγD-Crys sample taken at a series of UVR exposure times: 0 min (lane 1), 25 min (lane 2), 45 min (lane 3), 70 min (lane 4), 100 min (lane 5), 120 min (lane 6). Marked sites: large protein aggregates unable to enter gel (i), high molecular weight species (ii), HγD-Crys dimer-sized band (iii), monomeric HγD-Crys band (iv), lower molecular weight degradation products (v). (b) Graphs of quantification of band density for the monomeric ca 20 kDa band (left axis) and the dimeric ca 40 kDa band (right axis) from the gel image in (a).
