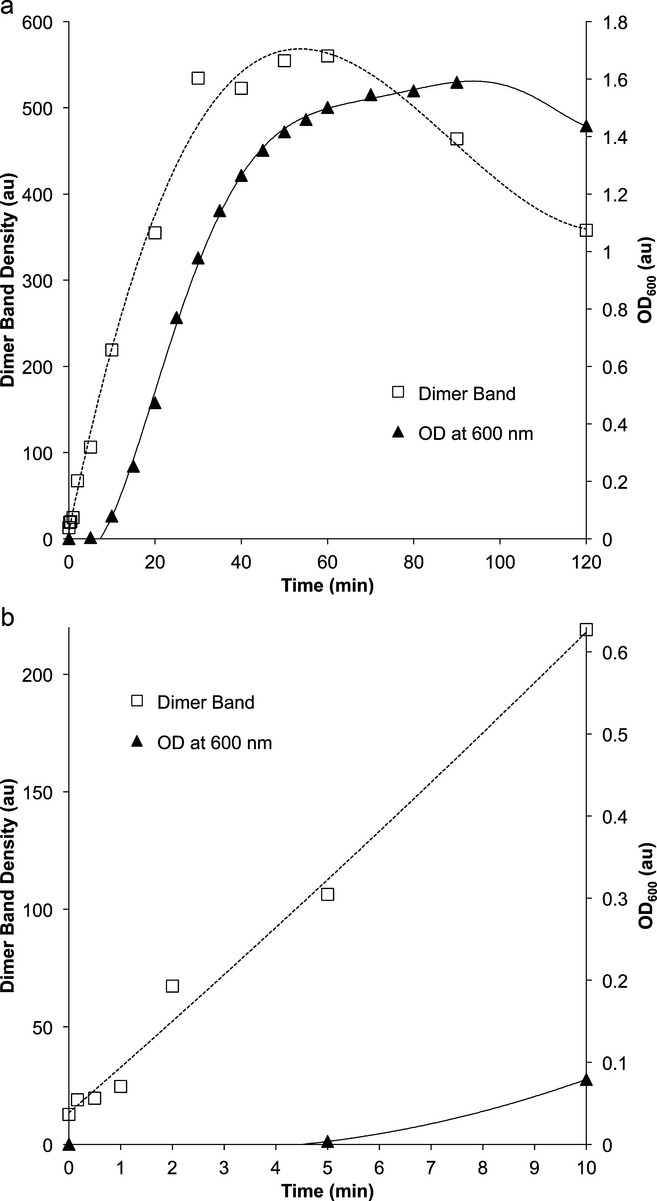
Figure 6.

(a) Turbidity development at OD600 of 1 mg mL−1 wild-type (WT) HγD-Crys sample (black triangles and solid line, right axis) and dimer gel band density quantification from SDS-PAGE of the same WT HγD-Crys sample (open squares and dotted line, left axis) versus ultraviolet radiation (UVR) exposure time. Curves were generated using polynomial fits. (b) The same data are presented from (a), examining just the earliest time points from 0 to 10 min of UVR exposure.
