
Fig 3.
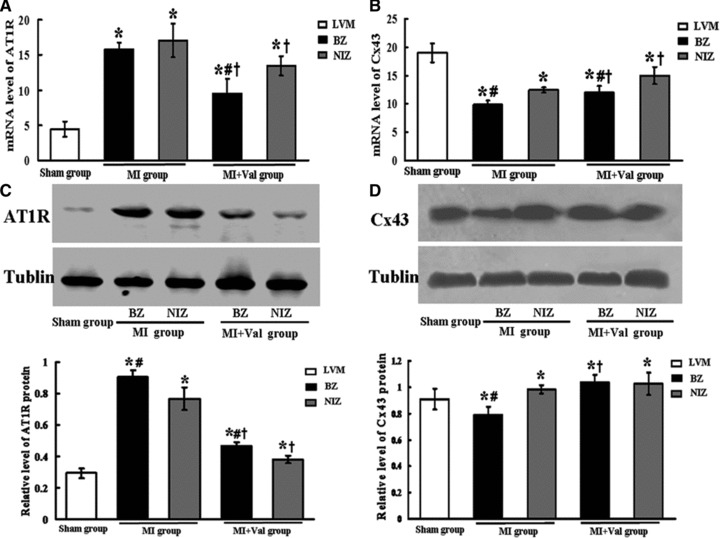
Effects of valsartan on expressions of AT1R and Cx43. The mRNA levels of (A) AT1R and (B) Cx43 were evaluated by the real-time PCR (n = 6). The protein levels of (C) AT1R and (D) Cx43 were analysed by Western blot (n = 7). Proteins loading of each sample in different groups were normalized by Tublin, the house keeping gene. BZ: border zone; NIZ: non-infarct zone. *P < 0.05 versus Sham group; #P < 0.05 versus NIZ; †P < 0.05 versus MI group.