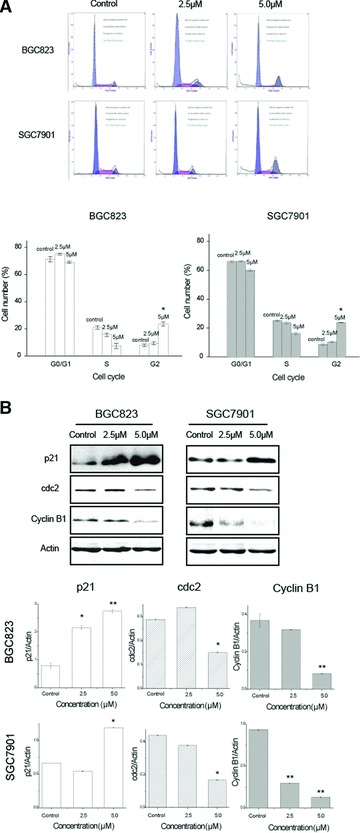
Fig 3.

Effect of CK on the cell cycle distribution of human gastric carcinoma cells. (A) Cells were treated with different concentrations of CK (0, 2.5 and 5.0 μmol/l) for 24 hrs. The cell cycle distribution was determined by PI staining assay. Data are reported as means ± S.D. of three separate experiments. * and ** indicate P < 0.05 and P < 0.01 compared with control group, respectively. (B) Cells were treated with different concentrations of CK (0, 2.5 and 5.0 μmol/l) for 24 hrs. The total protein was extracted and the expression of cell cycle-related proteins was analysed by Western blot assay. Data are reported as means ± S.D. of three separate experiments. * and ** indicate P < 0.05 and P < 0.01 compared with control group, respectively.
