
Fig 6.
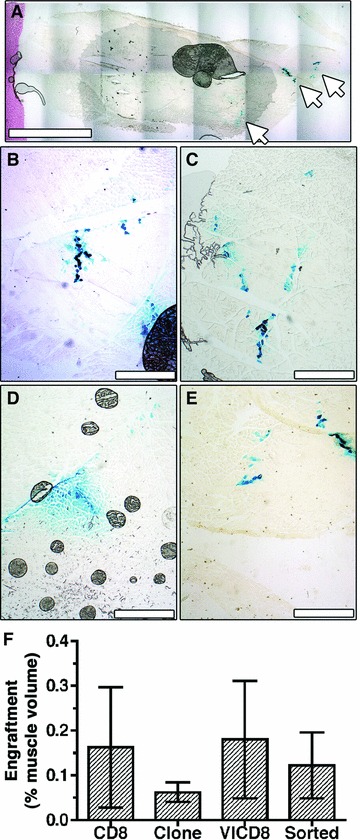
Myoblast engraftment is minimal compared to muscle size. Myoblast engraftment was revealed by X-Gal staining (blue) on frozen sections of the same medial hamstring muscles shown in Figure 4. (A) A low magnification image of a cross-section of the entire muscle implanted with transduced myoblasts shows cell engraftment only along the needle tracts of cell injections (white arrows). Higher magnification images showing similarly low engraftment rates with control cells (B), reference clone cells (C), the primary transduced population (D) and purified cells (E). Size bars 4 mm (A) and 400 μm (B–E). (F) Engraftment was quantified on all X-Gal stained sections and expressed as a percent of the total muscle volume (n = 3–5).