
Fig 3.
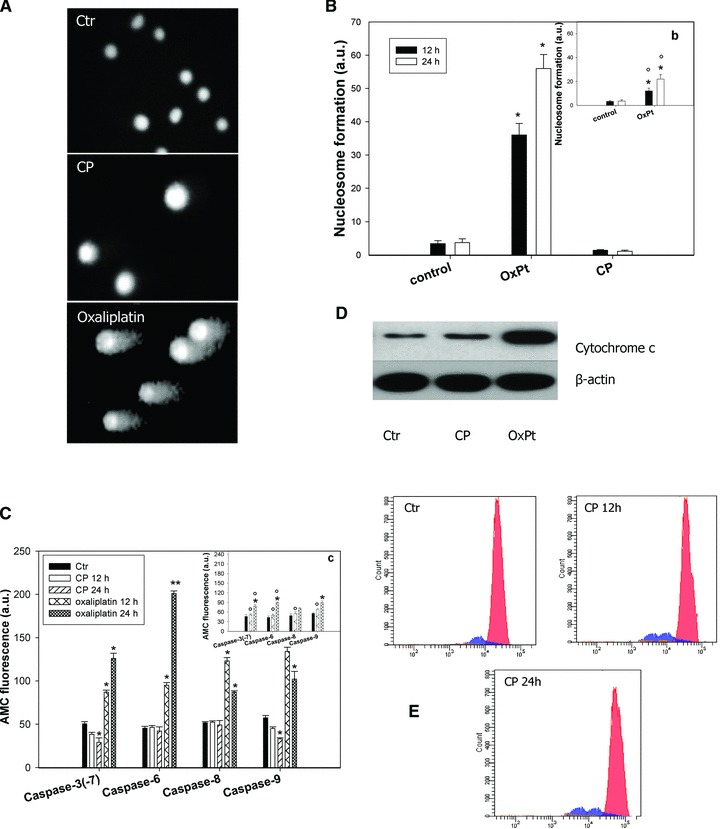
Non-apoptotic cell death induction. (A) Comet assay. LoVo cells treated for 12 hrs with IC50 of CP or O×Pt. (B) Nuclear DNA fragmentation. LoVo cells were treated for 12 or 24 hrs with IC50 of CP or O×Pt. Quantitative estimation of DNA fragmentation was obtained with an ELISA test. *P < 0.05 compared to control. Insert (b) LoVo–O×Pt cells treated for 12 or 24 hrs with IC50 of O×Pt. Data are the means of five independent experiments. Error bars indicate S.D. *P < 0.05 compared to control and °P < 0.05 compared to O×Pt treated LoVo cells. (C) Caspase activity. LoVo cells incubated for 12 and 24 hrs with CP or O×Pt and processed for caspase-3/-7, -6, -8, -9 activity. Insert (c): LoVo–O×Pt cells treated for 12 or 24 hrs with IC50 of O×Pt. Data are the means of at least three independent experiments. Error bars indicate S.D. *P < 0.05 compared to control and °P < 0.05 compared to O×Pt treated LoVo cells. (D) Cytochrome c release. LoVo cells treated with IC50 of tested compounds for 12 hrs and cytochrome c was estimated by Western blotting. (E) Flow cytometric profiles of LoVo cells untreated and treated with IC50 of CP for 12 and 24 hrs and stained with TMRM.