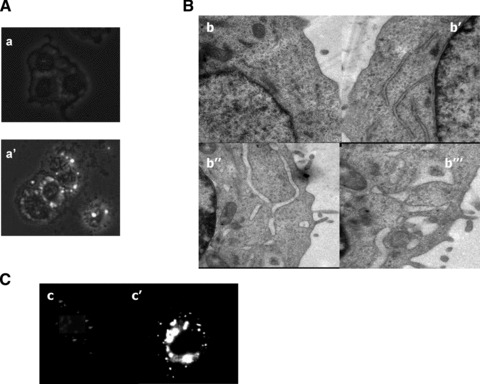
Fig 4.

Morphological changes in CP-treated LoVo cells. (A) Phase-contrast micropho-tographs (100×) of control (a) or treated for 24 hrs with IC50 of CP (a′) LoVo cells. (B) TEM analysis of control (b), or CP-treated LoVo cells for 12 hrs (b′) or 24 hrs (b″ and b‴). (C) Calnexin staining of control LoVo cells (c) or exposed to CP for 12 hrs (c′).
