
Fig 1.
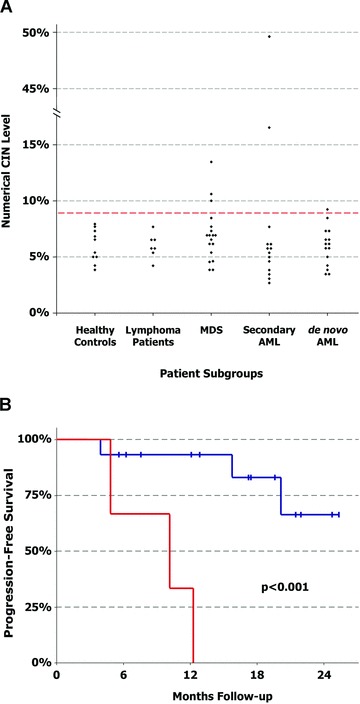
Numerical CIN correlates with outcome in patients with MDS. (A) Comparison of the median numerical CIN levels in CD34+ haematopoietic progenitor cells from healthy control subjects, control patients with lymphoma not involving the CD34+ cell compartment, MDS patients, patients with secondary AML and patients with de novo AML. The dashed red line indicates the cut-off between normal and elevated numerical CIN levels (mean + 2 SD of the numerical CIN levels in healthy control subjects). (B) Kaplan–Meier plot showing the progression-free survival of MDS patients with normal (blue line) and elevated numerical CIN levels (red line) at a median follow-up of 17.2 months (log-rank test: P < 0.001). The combined end-point was defined as either progression to AML or death.