Fig 2.

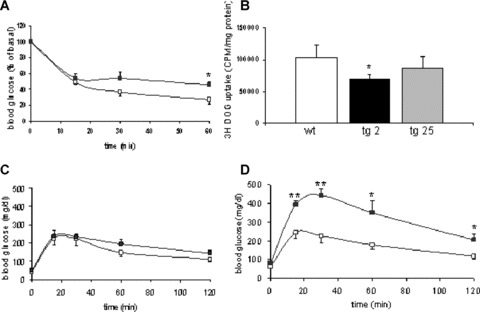
Insulin tolerance, glucose uptake and glucose tolerance test in PKC-β2 transgenic and wild-type mice. (A) Insulin tolerance test in 12-week-old PKC-β2 transgenic (black squares) and wild-type mice (white squares) after intraperitoneal injection of 1 unit/kg body weight of human regular insulin. Means ± S.E.M., n= 4. *P < 0.05. (B) 2-DOG uptake into skeletal muscle following intraperitoneal glucose injection in wild-type and PKC-β2 transgenic mice. Means ± S.E.M., n= 6. *P < 0.05. (C) Glucose tolerance test in 12-week-old PKC-β2 transgenic (black squares) and wild-type mice (white squares) after intraperitoneal injection of glucose. Means ± S.E.M., n= 4. (D) Glucose tolerance test in 6-month-old PKC-β2 transgenic (black squares) and wild-type mice (white squares) after intraperitoneal injection of glucose. Means ± S.E.M., n= 4. *P < 0.05, **P < 0.01.
