
Fig 3.
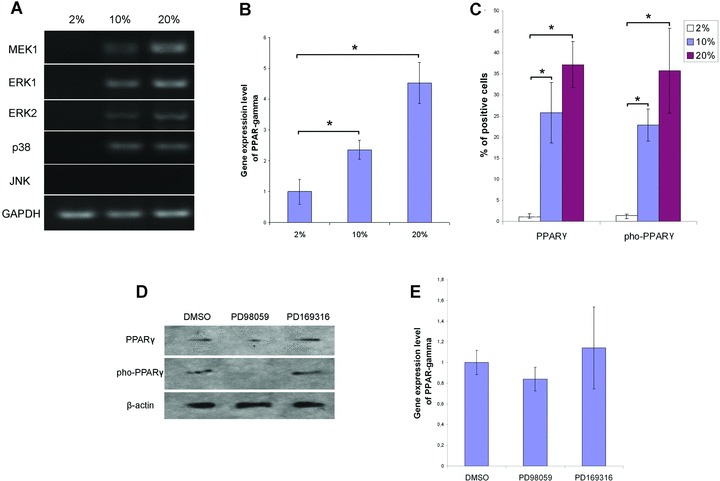
Inhibition of MEK activation reduced the expression and phosphorylation of PPARγ. (A) RT-PCR demonstrated the activation of MAPK signalling pathway. Total RNA of MSCs cultured in expansion medium was isolated for RT-PCR using the specific primers listed in Table 1. The values 2%, 10% and 20% indicate the percentages of FBS in the expansion media MSCs were kept in before RNA isolation. (B) Relative gene expression of PPARγ in MSCs cultured in different concentration of FBS. The values 2%, 10% and 20% indicate the percentages of FBS in the expansion media MSCs were kept in before RNA isolation. Data were normalized to β-actin and represented as mean ± S.D. (n= 3). * (P < 0.05) denotes statistical significance between the indicated pairs. (C) Percentages of PPARγ expressing and phosphorylating cells in MSCs. Immunofluorescent images were analyzed to compare PPARγ expression and phosphorylation in MSCs cultured in the expansion media with 2%, 10% or 20% FBS. Positive cell ratio was calculated as percentage of total cell number. Data were represented as mean ± S.D. (n= 3). (D) Inhibitor PD98059 reduced the expression and phosphorylation of PPARγ. Upon isolation of MSCs, 50 μM of PD98059 or 10 μM of PD169316 were added to the expansion medium containing 10% FBS. At the end of primary culture (7 days), total proteins of MSCs were extracted for Western blot to detect the expression and phosphorylation of PPAR. (E) Quantitative analysis of PPARγ expression when MEK and MAPK p38 was inhibited by specific inhibitor. Upon isolation of MSCs, 50 μM of PD98059 or 10 μM of PD169316 were added to the expansion medium containing 10% FBS. At the end of primary culture (7 days), total RNA of MSCs were extracted for real-time PCR. Data were normalized to β-actin and represented as mean ± S.D. (n= 3).