
Fig 3.
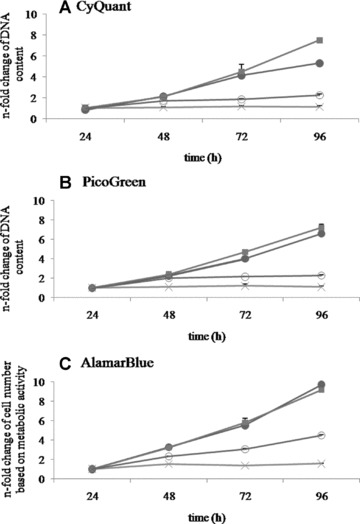
Direct comparison of n-fold change in DNA content measured by CyQuant (A) and PicoGreen (B); n-fold change of cell numbers based on metabolic activity assessed by AlamarBlue (C) after 24, 48, 72, 96 hrs of OV-MZ-6 (•), SKOV-3 (▪), HUCPVC (○), bmMSC (X). CyQuant and PicoGreen showed a 7.5/7.2- and 5.3/6.6-fold increase of DNA content of both cancer cell lines SKOV-3 and OV-MZ-6, respectively, between 24 and 96 hrs. However, AlamarBlue estimated a 9.2/9.7-fold-change of cell numbers based on metabolic activity. CyQuant and PicoGreen showed a 2.3/1.1-fold increase of DNA content of HUCPVC and bmMSC, respectively, during the 4-day time span. AlamarBlue estimated a 4.5/1.5-fold change in cell numbers of HUCPVC and bmMSC based on metabolic activity during 24 to 96 hrs in cell culture.