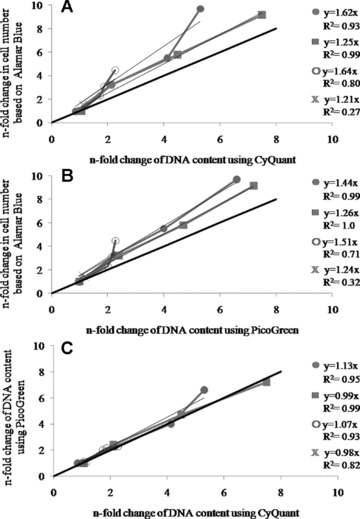
Fig 4.

Correlations between AlamarBlue/PicoGreen (A) and AlamarBlue/ CyQuant (B) PicoGreen/CyQuant (C) assessing cell proliferation of OV-MZ-6 (•), SKOV-3 (▪), HUCPVC (○), bmMSC (X) based on the results shown in Fig. 3. The estimation of cell proliferation based on AlamarBlue correlated well with 0.7 < R2 < 1 with increased DNA measured by CyQuant and PicoGreen except for bmMSC (R2= 0.27/0.32). However, this technique resulted in an over-estimation of cell proliferation from 21% to 64%. PicoGreen and CyQuant correlated well with 0.82 < R2 < 0.99 and a deviation from the reference line from 2% to 13%.
